
At K2, we regularly work on large scale construction projects that often have thousands, if not tens of thousands of activities in their project schedules. This can make the project schedule difficult to understand, analyze, and use as a tool to manage the project. The overall quality of the schedule has a direct impact on the project team’s ability to plan, manage, and execute the project’s scope of work. A robust project schedule with a clearly defined scope, estimating techniques, and logic will lead to improved project performance and higher quality EACs (Estimate at Completes). Alternatively, low quality project schedules can lead to confusion and uncertainty around project performance and future forecasts.
How can the project team quickly and efficiently identify the pain points of a project schedule when there are so many project activities? Enter Deltek Acumen. This software is designed to automate the schedule analysis process and return an entire suite of performance metrics that objectively validates the strengths and weaknesses of a schedule. At K2, we use Acumen to gain valuable insights into schedule quality and identify the areas that need to be improved to produce a schedule that can be used with a high level of confidence.
How to Import a Project Schedule into Deltek Acumen:
The S1 // Projects tab is designed to import external data into Acumen for analysis. Project schedules can be imported from a variety of software, such as Microsoft Project, Excel, and P6. All Deltek importing options can be seen in the graphic below.
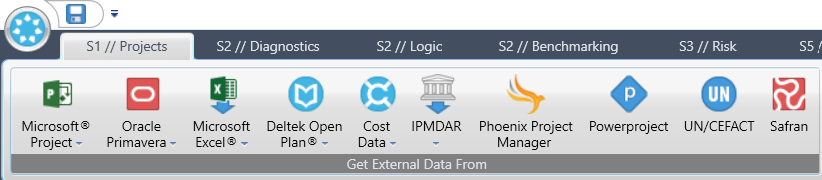
When selecting one of the import options, a drop-down menu will appear that enables the user to easily import project data. Once the project has been imported, the S1 // Projects tab will display information such as the number of activities in the project schedule, project start date, project finish date, and a Gantt chart that can be delineated to the level of WBS that is desired. The S1 // Projects tab is primarily used to summarize project information and pave the way for accurate schedule analysis.
How to Analyze a Project Schedule using Deltek Acumen Fuse:
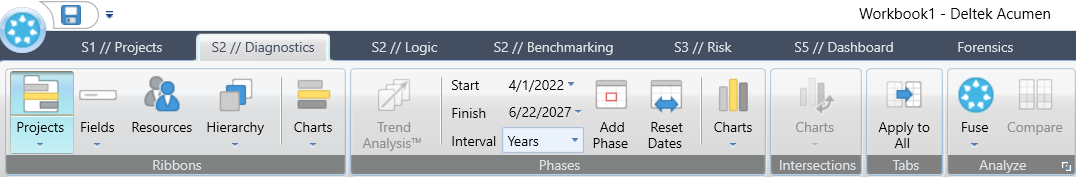
Schedule analysis is conducted using Acumen’s Fuse functionality, which is located on the S2 // Diagnostics tab. Acumen comes pre-set with dozens of schedule analysis diagnostics all having different purposes and metrics that are used to analyze a project schedule. A list of standard Acumen diagnostics can be seen in the figure below.

Before beginning the review of the schedule, one must identify which metrics will be used to analyze the project. The first option is to select a standard diagnostic, which comes with its own unique set of metrics that are used to analyze the schedule. The second option is to create your own custom diagnostic by mixing and matching metrics between the standard diagnostics listed above. The third option is to create custom metrics or modify existing metrics if there is information required that is outside of the standard software package. Once the desired project metrics have been selected, it is time to run the assessment. Select the Fuse button in the S2 // Diagnostics ribbon to run the schedule analysis.
An example of a schedule analysis was run using the “Schedule Quality” diagnostic. The results from the analysis are below.
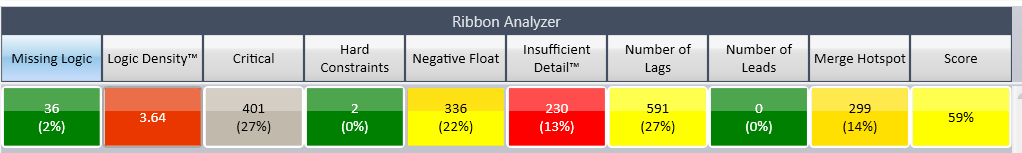
Many of the metrics in the “Schedule Quality” diagnostic have a numerator and a denominator. It is most common for the numerator to represent the number of occurrences in the project schedule while the denominator represents the percentage of activities in the project that were flagged for the metric. However, this is dependent upon the formulas and logic for each metric and is often different depending on the analysis being performed. Having a denominator is entirely optional and may be unnecessary, depending on the metric being calculated.
Fuse will also generate metric scores for specific time periods within the project as well. The time periods are customizable and can be set to days, weeks, months, quarters, or years, depending on the user’s preference.
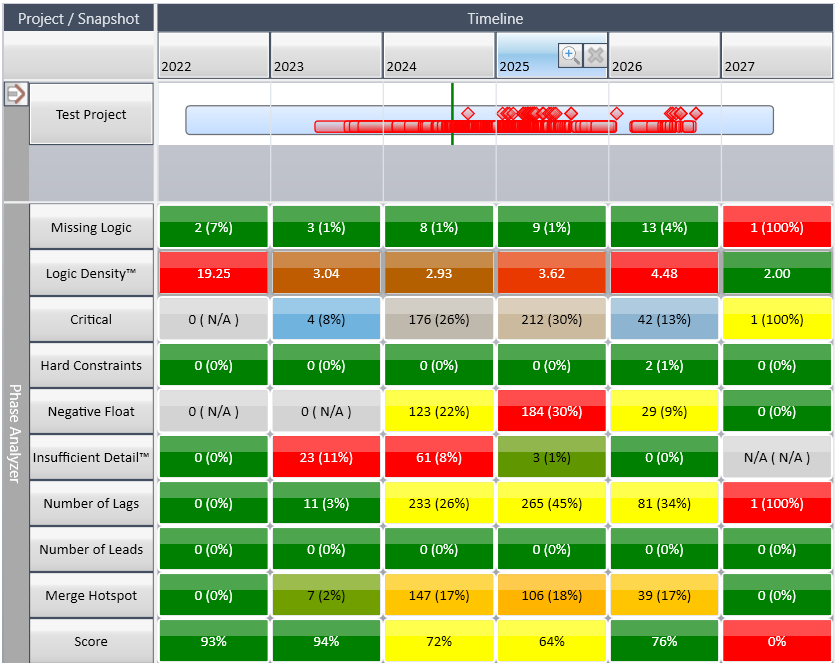
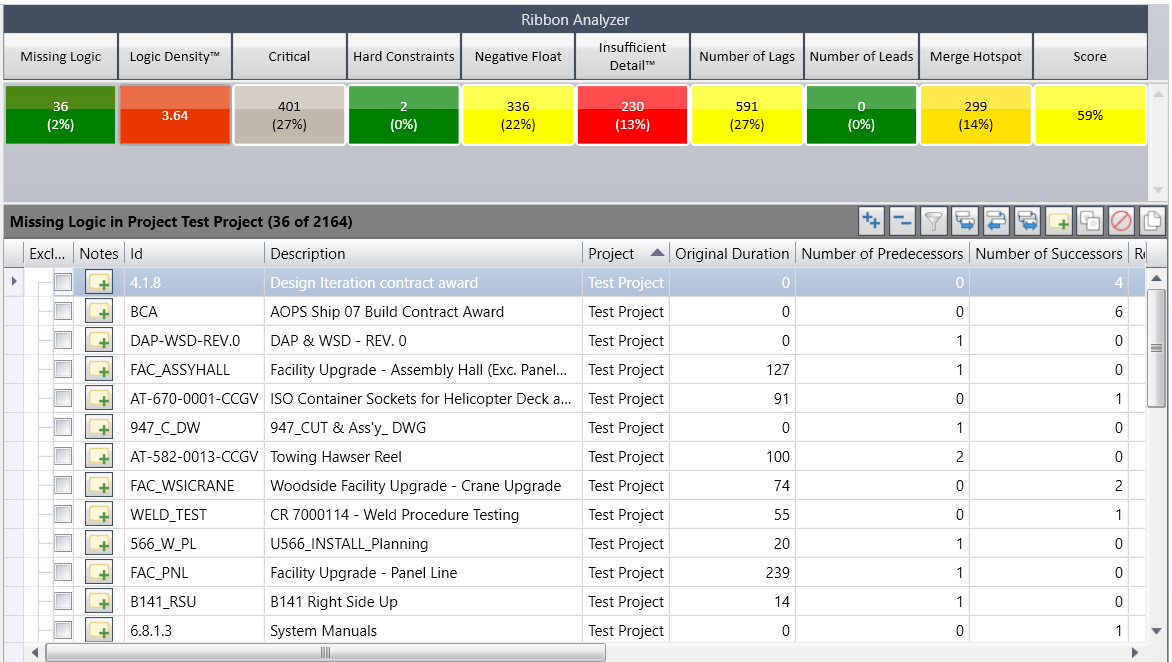
Lastly, Fuse allows the user to select a metric and display all activities in the project schedule that were flagged for that metric. An example can be seen below for all activities in the test project that had missing logic.
The flagged activities for each metric can also be exported to Excel. This creates an opportunity for supplemental analysis, including the creation of pareto charts or histograms for each metric being analyzed.
Acumen Fuse is a quick and efficient way to analyze the quality of project schedules. The software is easily customizable and allows for detailed analysis regardless of the industry or size of schedule. Acumen also has additional capabilities outside of Fuse such as risk management, logic tracing, benchmarking, and forensics analysis. These capabilities, along with Fuse, provide our experts with insights into project schedules and are used to improve schedule quality and project performance.