
In large-scale construction projects, managing schedule delays and determining risk can be complex. It is often a challenge to summarize and interpret the impact of activity finish dates pushing right in large-scale construction projects with low quality schedules. When thousands of non-critical activities continuously push out every month, how can you efficiently track and interpret the impact on overall project performance? What if the project doesn’t have a well-defined critical path in the first place due to missing logic, hard constraints, lags, or relationship types? A bow wave report is a tool that mitigates these scenarios by summarizing and analyzing a project’s scope of work in terms of duration days by period to graphically depict the knock-on effect of slipping critical and non-critical tasks.
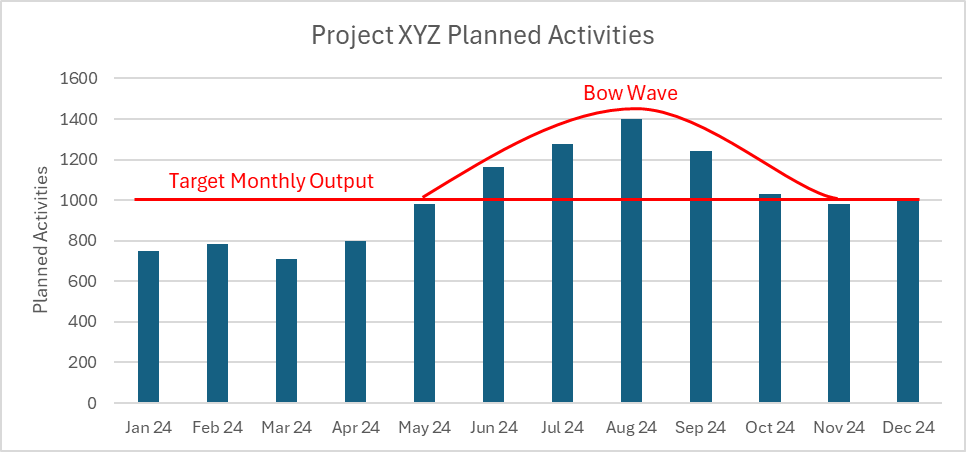
In the graphic above, you will see that from January through April the project team fell short of their target monthly output. As a result, those activities were pushed to May through August. This caused a drastic change in the planned number of activities between those two periods of performance. This is referred to as the bow wave effect, which resembles a change in future project work scope to recuperate poor past performance. Additionally, it can be used to graphically call into question the reasonableness of the current schedule. An even more useful application for a bow wave report is to overlay multiple schedule revisions on the same graph.
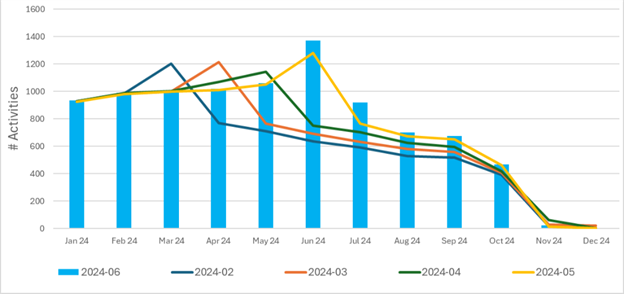
The legend in the graph denotes the data date that each schedule revision was submitted. It is evident that a trend of activities riding the date was present in most schedule revisions. For example, the February, March, April, and May schedules forecasted a drastic increase in planned scope of work in the first month succeeding the data date. This indicates that activity finish dates were pushed out roughly one month at a time.
When reading a bow wave report, it’s important to differentiate between historical data (actuals) and future projections (forecasts). For example, if the schedule date is 7/31/24, the bow wave report will show actuals from project start through July of 2024. For August 2024 onward, it will display a forecast of the number of activities planned to be in progress, based on current scheduling assumptions.
The existence of a bow wave effect does not necessarily indicate that the project is at risk. There may be periods of performance within a project schedule that have a higher concentration of planned activities due to the environment of the project. Additionally, corrective actions or schedule compression techniques may be used to increase efficiency and recover lost time. The bow wave effect should be used as a leading indicator to determine whether schedule forecasts look realistic. Ultimately, it is up to the individual to analyze the project to determine whether a given bow wave effect is justified due to current project conditions or if there are deeper concerns.
How to Generate a Bow Wave Report
At K2, we most often create bow wave reports by exporting project data from Primavera P6 into Microsoft Excel. The main information needed from P6 will be the Activity name / Activity ID, start date, and end date. Once project data is exported to Excel, activities for each month are counted in the project’s period of performance. For example, if an activity has a start date of 1/1/24 and a finish date of 3/15/24, then that activity would be counted for the months of January, February, and March.
After a count of project activities per month has been taken, a simple bar chart is generated with the desired period of performance on the x-axis and the quantity of planned activities on the y-axis. At K2, we often plot multiple versions of project schedules on the same graph for comparison. This helps us determine the magnitude of change between project schedule submissions. Bow wave reports are a highly effective diagnostic tool that can be used to analyze past performance and future forecasts in a project schedule. If you aren’t leveraging bow wave reports in your project management strategy, you should consider doing so.